The D.A.T.A. Project
In the D.A.T.A. project we chose a subject that we wanted to study about and then once we had our data we displayed our information in a creative way on an infographic. The infographic had to have quantitative (numerical), qualitative (categorical) and bivariate data (a study looking at two relationships/ variables) that helped answer our question's in a variety of ways. First, we had to decide what it was we wanted to study. I chose to do my data analysis on health and nutrition. Once we chose the theme for our infographic we generated questions that would help us further understand our subject. Nicole then generated a massive survey that everyone on our team filled out and from there we received our data. The questions on the survey varied depending on what the person who created the question was studying. One of my questions was, "how many hours a week do you exersize?" and from the responses I received, I took the average and displayed it on my infographic. Once we sorted out all our data and created it all into graphs or charts, we finally started to put them down on an empty "canvas" on any program the student chose to use. Most commonly used programs by my classmates were Photoshop, Pixlr, Microsoft Word and Publisher. Once we had that done, we turned in a first draft and got our infographic critiqued by our peers and teacher. I felt the critique was very helpful because I ended up completely starting over. I got to see many other examples from my classmates work and the feedback I received from them helped me realize my work was not a final product. Then we did one more final look through by our peers for spelling, grammatical issue's or any last minute fixes. Then, finally we turned in our final infographic. I am very proud of my final product, it came out a lot better than I thought it would and I made a lot of progress from my first draft. All in all, I found the project to be very informative and interesting. I chose a topic that really interested me and seeing the results of my data was very fascinating.
I chose to study the health and nutrition of our team.
Questions I asked for the survey:
1. How many hours a week do you exersize?
2. How many fruits or vegetables do you eat per day combined?
3. Do you bring your own lunch?
4. If you don't bring your own lunch, then where do you shop?
5. How much do you spend on lunch per week?
6. On a scale of 1-5 how much do take your nutrition into consideration when buying or making your lunch?
7. How much money do you spend at Liberty Station a week?
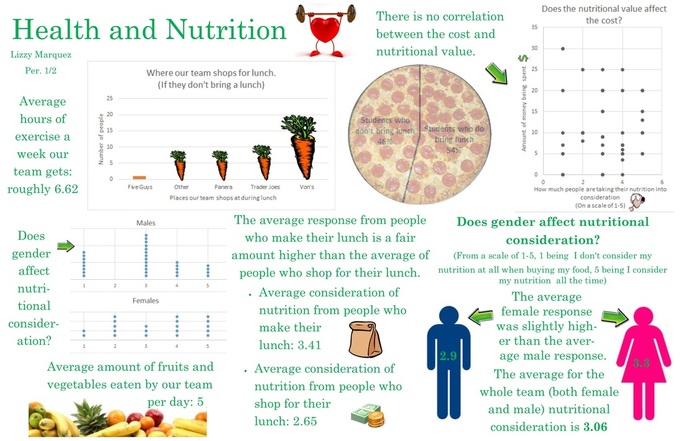
I discovered a lot about my peers through this project. One conclusion I made that struck me from my qualitative data was that the 'students who do bring lunch' was a slightly higher amount than the 'students who don't bring lunch'. This struck me because I figured since we are aloud to go to Liberty Station, many kids would be buying lunches from the companies and facilities there. One conclusion I made that surprised me from my quantitative data was the 'amount of exercise a week our team gets' it was a lot higher than the amount I would've estimated. One conclusion I made from my bivariate data was that the girls responses were a lot more spread out and the boys responses all kind of clumped together in certain areas for the 'does gender affect nutritional consideration?' chart.
